Extraction functions for 'gets' objects
coef.gets.RdExtraction functions for objects of class 'gets'
Usage
# S3 method for class 'gets'
coef(object, spec=NULL, ...)
  # S3 method for class 'gets'
fitted(object, spec=NULL, ...)
  # S3 method for class 'gets'
logLik(object, ...)
  # S3 method for class 'gets'
plot(x, spec=NULL, col=c("red","blue"),
    lty=c("solid","solid"), lwd=c(1,1), ...)
  # S3 method for class 'gets'
predict(object, spec=NULL, n.ahead=12, newmxreg=NULL,
    newvxreg=NULL, newindex=NULL, n.sim=5000, innov=NULL, probs=NULL,
    ci.levels=NULL, quantile.type=7, return=TRUE, verbose=FALSE, plot=NULL,
    plot.options=list(), ...)
  # S3 method for class 'gets'
print(x, signif.stars=TRUE, ...)
  # S3 method for class 'gets'
residuals(object, std=NULL, ...)
  # S3 method for class 'gets'
sigma(object, ...)
  # S3 method for class 'gets'
summary(object, ...)
  # S3 method for class 'gets'
vcov(object, spec=NULL, ...)
Arguments
- object
an object of class 'gets'
- x
an object of class 'gets'
- spec
NULL, "mean", "variance" or, in some instances, "both". When
NULLis a valid value, then it is automatically determined whether information pertaining to the mean or variance specification should be returned- signif.stars
logical. IfTRUE, then p-values are additionally encoded visually, seeprintCoefmat- std
logical. IfFALSE(default), then the mean residuals are returned. If TRUE, then the standardised residuals are returned- n.ahead
integerthat determines how many steps ahead predictions should be generated (the default is 12)- newmxreg
a
matrixofn.aheadrows andNCOL(mxreg)columns with the out-of-sample values of themxregregressors- newvxreg
a
matrixofn.aheadrows andNCOL(vxreg)columns with the out-of-sample values of thevxregregressors- newindex
NULL(default) or the date-index for thezooobject returned bypredict.arx. IfNULL, then the function uses the in-sampleindexto generate the out-of-sample index- n.sim
integer, the number of replications used for the generation of the forecasts- innov
NULL(default) or a vector of lengthn.ahead * n.simcontaining the standardised errors (that is, zero mean and unit variance) used for the forecast simulations. IfNULL, then a classica bootstrap procedure is used to draw from the standardised in-sample residuals- probs
NULL(default) or avectorwith the quantile-levels (values strictly between 0 and 1) of the forecast distribution. IfNULL, then no quantiles are returned unlessci.levelsis non-NULL- ci.levels
NULL(default) or avectorwith the confidence levels (expressed as values strictly between 0 and 1) of the forecast distribution. The upper and lower values of the confidence interval(s) are returned as quantiles- quantile.type
an integer between 1 and 9 that selects which algorithm to be used in computing the quantiles, see the argument
typeinquantile- return
logical. IfTRUE(default), then the out-of-sample predictions are returned. The valueFALSE, which does not return the predictions, may be of interest if only a prediction plot is of interest- verbose
logicalwith defaultFALSE. IfTRUE, then additional information (typically the quantiles and/or the simulated series) used in the generation of forecasts is returned. IfFALSE, then only the forecasts are returned- plot
NULL(default) or logical. IfNULL, then the value set byoptions$plot(seeoptions) determines whether a plot is produced or not. IfTRUE, then the out-of-sample forecasts are plotted.- plot.options
a
listof options related to the plotting of forecasts, see 'Details'- col
colours of fitted (default=red) and actual (default=blue) lines
- lty
types of fitted (default=solid) and actual (default=solid) lines
- lwd
widths of fitted (default=1) and actual (default=1) lines
- ...
additional arguments
Details
The plot.options argument is a list that controls the prediction plot, see 'Details' in predict.arx
Value
- coef:
a numeric vector containing parameter estimates
- fitted:
a
zooobject with fitted values- logLik:
a numeric, the log-likelihood (normal density)
- plot:
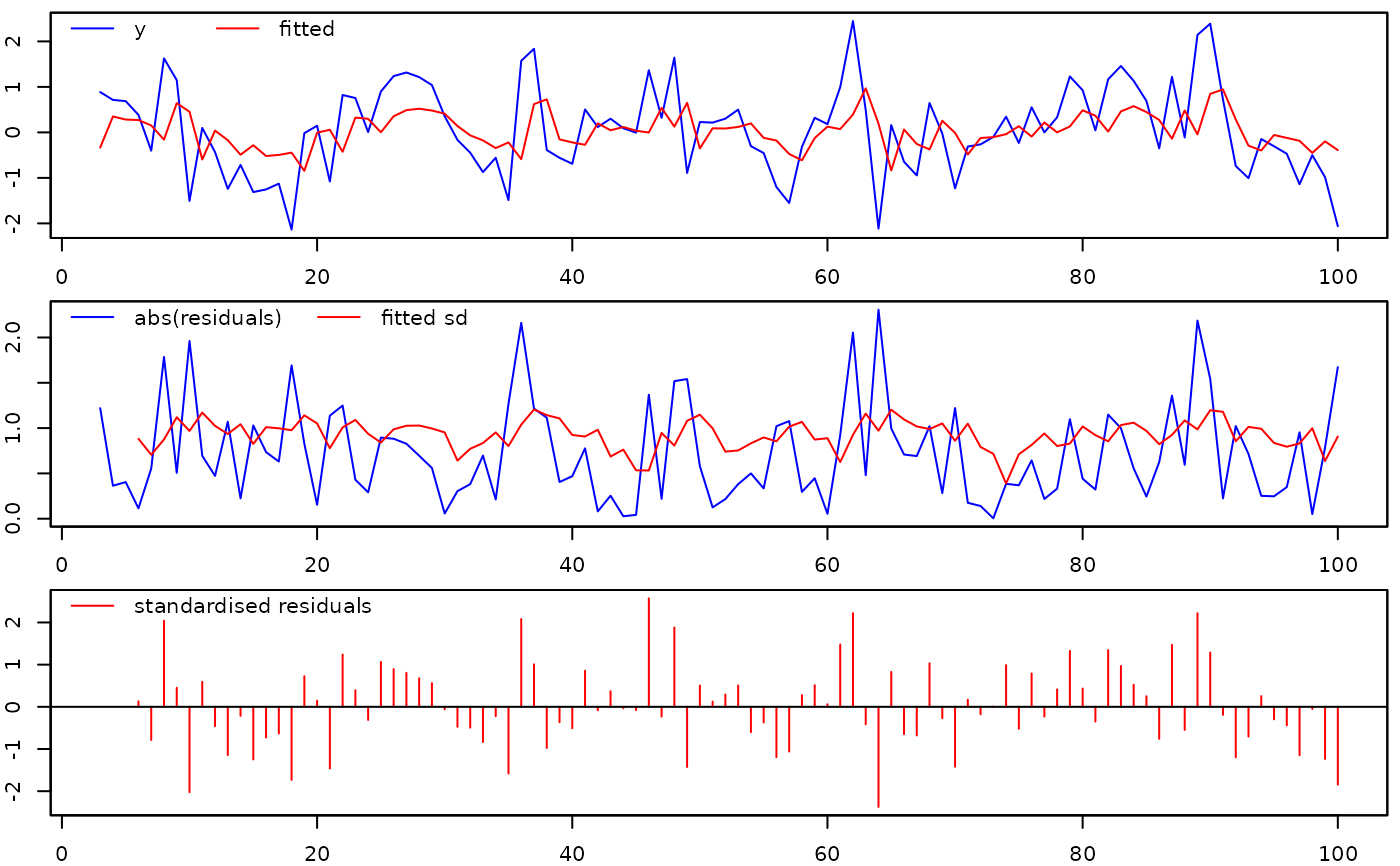
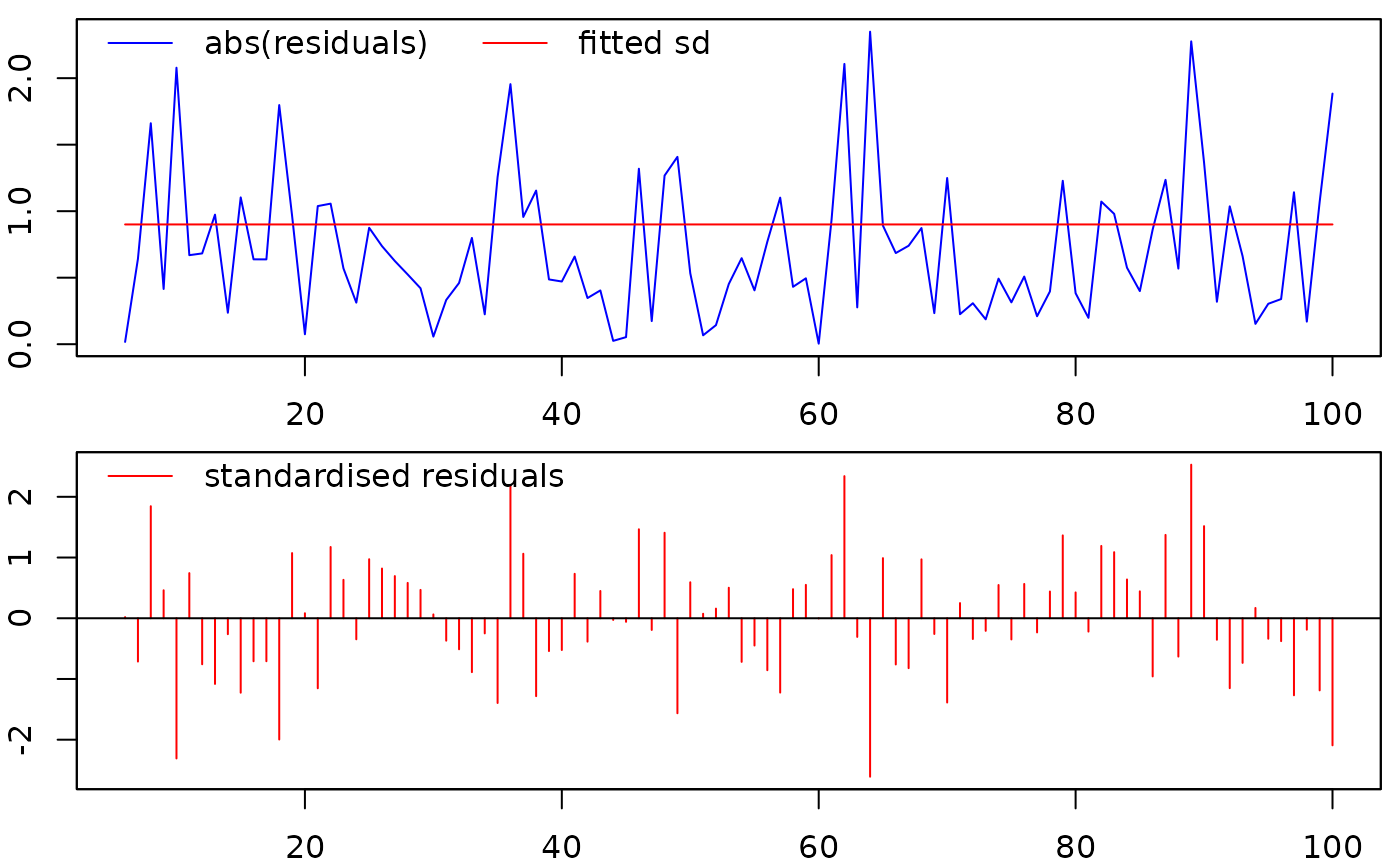
a plot of the fitted values and the residuals
- predict:
a
vectorof classzoocontaining the out-of-sample forecasts, or amatrixof classzoocontaining the out-of-sample forecasts together with prediction-quantiles, or - ifreturn=FALSE-NULL- print:
a print of the estimation results
- residuals:
a
zooobject with the residuals- sigma:
the regression standard error ('SE of regression')
- summary:
a print of the items in the
getsobject- vcov:
a variance-covariance matrix
Author
Felix Pretis, https://felixpretis.climateeconometrics.org/
James Reade, https://sites.google.com/site/jjamesreade/
Moritz Schwarz, https://www.inet.ox.ac.uk/people/moritz-schwarz
Genaro Sucarrat, https://www.sucarrat.net/
Examples
##Simulate from an AR(1):
set.seed(123)
y <- arima.sim(list(ar=0.4), 100)

##Simulate four independent Gaussian regressors:
xregs <- matrix(rnorm(4*100), 100, 4)

##estimate an AR(2) with intercept and four conditioning
##regressors in the mean, and a log-ARCH(3) in the variance:
mymod <- arx(y, mc=TRUE, ar=1:2, mxreg=xregs, arch=1:3)

##General-to-Specific (GETS) model selection of the mean:
meanmod <- getsm(mymod)
#>
#> GUM mean equation:
#>
#>        reg.no. keep      coef std.error  t-stat   p-value
#> mconst       1    0  0.043088  0.094883  0.4541 0.6508240
#> ar1          2    0  0.406777  0.107385  3.7880 0.0002723 ***
#> ar2          3    0 -0.014965  0.110010 -0.1360 0.8920956
#> mxreg1       4    0 -0.071650  0.096881 -0.7396 0.4614659
#> mxreg2       5    0 -0.043913  0.101653 -0.4320 0.6667745
#> mxreg3       6    0 -0.033421  0.095433 -0.3502 0.7269975
#> mxreg4       7    0 -0.079345  0.094225 -0.8421 0.4019547
#> ---
#> Signif. codes:  0 ‘***’ 0.001 ‘**’ 0.01 ‘*’ 0.05 ‘.’ 0.1 ‘ ’ 1
#>
#> GUM log-variance equation:
#>
#>             coef std.error  t-stat p-value
#> vconst -0.185723  0.339150  0.2999  0.5840
#> arch1   0.071754  0.105315  0.6813  0.4974
#> arch2  -0.091189  0.105499 -0.8644  0.3897
#> arch3   0.052295  0.105789  0.4943  0.6223
#>
#> Diagnostics:
#>
#>                   Chi-sq df p-value
#> Ljung-Box AR(3)   2.9699  3 0.39629
#> Ljung-Box ARCH(4) 4.3880  4 0.35603
#>
#> 6 path(s) to search
#> Searching:
#> 1
#> 2
#> 3
#> 4
#> 5
#> 6
#>
#>   Path 1: 1 3 6 5 4 7
#>   Path 2: 3 6 5 1 4 7
#>   Path 3: 4 3 6 5 1 7
#>   Path 4: 5 3 6 1 4 7
#>   Path 5: 6 3 5 1 4 7
#>   Path 6: 7 3 6 1 5 4
#>
#> Terminal models:
#>
#>                 info(sc)     logl  n k
#> spec 1 (1-cut): 2.616031 -125.893 98 1
#>
#> Retained regressors (final model):
#>
#>   ar1

##General-to-Specific (GETS) model selection of the variance:
varmod <- getsv(mymod)
#> GUM log-variance equation:
#>
#>        reg.no. keep      coef std.error  t-stat p-value
#> vconst       1    1 -0.185723  0.339150  0.2999  0.5840
#> arch1        2    0  0.071754  0.105315  0.6813  0.4974
#> arch2        3    0 -0.091189  0.105499 -0.8644  0.3897
#> arch3        4    0  0.052295  0.105789  0.4943  0.6223
#>
#> Diagnostics:
#>
#>                   Chi-sq df p-value
#> Ljung-Box AR(3)   2.9699  3 0.39629
#> Ljung-Box ARCH(4) 4.3880  4 0.35603
#>
#> 3 path(s) to search
#> Searching:
#> 1
#> 2
#> 3
#>
#>   Path 1: 2 4 3
#>   Path 2: 3 4 2
#>   Path 3: 4 2 3
#>
#> Terminal models:
#>
#>                 info(sc)      logl  n k
#> spec 1 (1-cut): 2.675753 -124.8213 95 1
#>
#> Retained regressors (final model):
#>
#>   vconst

##print results:
print(meanmod)
#>
#> Date: Mon Apr  7 09:08:17 2025
#> Dependent var.: y
#> Method: Ordinary Least Squares (OLS)
#> Variance-Covariance: Ordinary
#> No. of observations (mean eq.): 98
#> Sample: 3 to 100
#>
#> SPECIFIC mean equation:
#>
#>         coef std.error t-stat   p-value
#> ar1 0.395234  0.095397  4.143 7.328e-05 ***
#> ---
#> Signif. codes:  0 ‘***’ 0.001 ‘**’ 0.01 ‘*’ 0.05 ‘.’ 0.1 ‘ ’ 1
#>
#> SPECIFIC log-variance equation:
#>
#>            coef std.error t-stat p-value
#> vconst 0.132172  0.314689 0.1764  0.6745
#> arch1  0.168115  0.105649 1.5913  0.1150
#> arch2  0.041319  0.107019 0.3861  0.7003
#> arch3  0.012057  0.108241 0.1114  0.9116
#>
#> Diagnostics and fit:
#>
#>                   Chi-sq df p-value
#> Ljung-Box AR(3)   2.4359  3  0.4870
#> Ljung-Box ARCH(4) 6.6894  4  0.1532
#>
#> SE of regression    0.90884
#> R-squared           0.14564
#> Log-lik.(n=95)   -125.89303
print(varmod)
#>
#> Date: Mon Apr  7 09:08:17 2025
#> Method: Ordinary Least Squares (OLS)
#> No. of observations (variance eq.): 95
#> Sample: 6 to 100
#>
#> SPECIFIC log-variance equation:
#>
#>            coef std.error t-stat p-value
#> vconst -0.21006   0.21965 0.9146  0.3389
#>
#> Diagnostics and fit:
#>
#>                   Chi-sq df p-value
#> Ljung-Box AR(3)   3.9427  3  0.2677
#> Ljung-Box ARCH(4) 5.2478  4  0.2628
#>
#> SE of regression    0.9003
#> Log-lik.(n=95)   -124.8213

##plot the fitted vs. actual values, and the residuals:
plot(meanmod)

plot(varmod)


##generate and plot predictions of the mean:
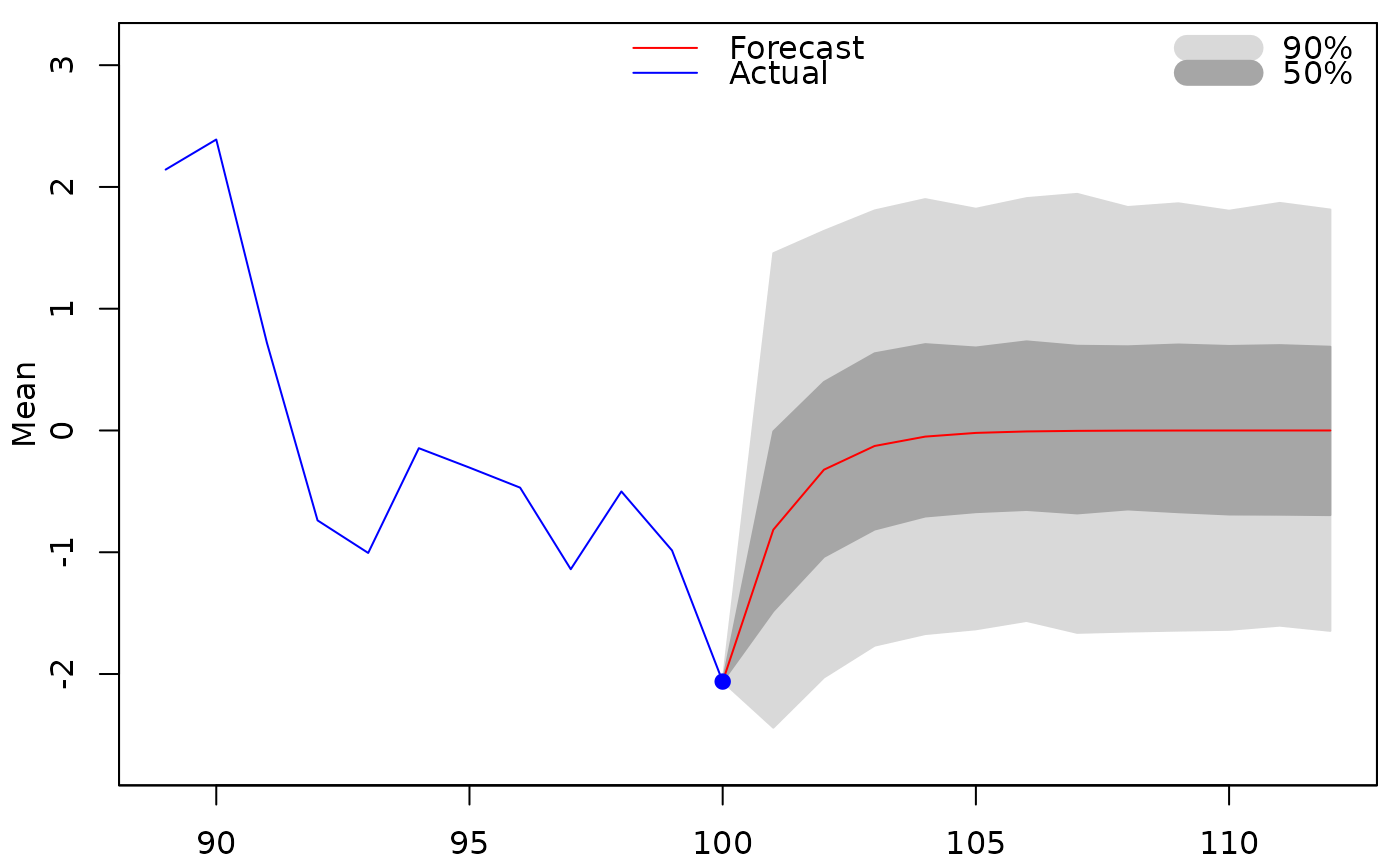
predict(meanmod, plot=TRUE)

#>           101           102           103           104           105
#> -8.149836e-01 -3.221089e-01 -1.273082e-01 -5.031648e-02 -1.988676e-02
#>           106           107           108           109           110
#> -7.859914e-03 -3.106501e-03 -1.227793e-03 -4.852651e-04 -1.917931e-04
#>           111           112
#> -7.580305e-05 -2.995991e-05

##print the entries of object 'gets':
summary(meanmod)
#>                      Length Class      Mode
#> date                  1     -none-     character
#> gets.type             1     -none-     character
#> time.started          1     -none-     character
#> time.finished         1     -none-     character
#> call                  2     -none-     call
#> gum.mean              6     data.frame list
#> gum.variance          4     data.frame list
#> gum.diagnostics       6     -none-     numeric
#> no.of.estimations     1     -none-     numeric
#> paths                 6     -none-     list
#> terminals             1     -none-     list
#> terminals.results     4     -none-     numeric
#> best.terminal         1     -none-     numeric
#> specific.spec         1     -none-     numeric
#> version               1     -none-     character
#> aux                  20     -none-     list
#> n                     1     -none-     numeric
#> k                     1     -none-     numeric
#> df                    1     -none-     numeric
#> coefficients          1     -none-     numeric
#> mean.fit             98     zoo        numeric
#> residuals            98     zoo        numeric
#> rss                   1     -none-     numeric
#> sigma2                1     -none-     numeric
#> vcov.mean             1     -none-     numeric
#> logl                  1     -none-     numeric
#> Elnz2                 1     -none-     numeric
#> vcov.var              9     -none-     numeric
#> var.fit              98     zoo        numeric
#> std.residuals        98     zoo        numeric
#> ustar.residuals      98     zoo        numeric
#> variance.results      4     data.frame list
#> mean.results          4     data.frame list
#> specific.diagnostics  6     -none-     numeric
summary(varmod)
#>                      Length Class      Mode
#> date                  1     -none-     character
#> gets.type             1     -none-     character
#> time.started          1     -none-     character
#> time.finished         1     -none-     character
#> call                  2     -none-     call
#> gum.mean              4     data.frame list
#> gum.variance          6     data.frame list
#> gum.diagnostics       6     -none-     numeric
#> no.of.estimations     1     -none-     numeric
#> paths                 3     -none-     list
#> terminals             1     -none-     list
#> terminals.results     4     -none-     numeric
#> best.terminal         1     -none-     numeric
#> specific.spec         1     -none-     numeric
#> version               1     -none-     character
#> aux                  17     -none-     list
#> n                     1     -none-     numeric
#> k                     1     -none-     numeric
#> df                    1     -none-     numeric
#> mean.fit             95     zoo        numeric
#> residuals            95     zoo        numeric
#> rss                   1     -none-     numeric
#> sigma2                1     -none-     numeric
#> logl                  1     -none-     numeric
#> Elnz2                 1     -none-     numeric
#> vcov.var              0     -none-     numeric
#> var.fit              95     zoo        numeric
#> std.residuals        95     zoo        numeric
#> ustar.residuals      95     zoo        numeric
#> variance.results      4     data.frame list
#> specific.diagnostics  6     -none-     numeric

##extract coefficients of the simplified (specific) model:
coef(meanmod) #mean spec
#>       ar1
#> 0.3952335
coef(varmod) #variance spec
#>    vconst     Elnz2
#> -0.210060 -1.178012

##extract log-likelihood:
logLik(mymod)
#> 'log Lik.' -123.8917 (df=7)

##extract coefficient-covariance matrix of simplified
##(specific) model:
vcov(meanmod) #mean spec
#>             ar1
#> ar1 0.009100632
vcov(varmod) #variance spec
#> <0 x 0 matrix>

##extract and plot the fitted values:
mfit <- fitted(meanmod) #mean fit
plot(mfit)

vfit <- fitted(varmod) #variance fit
plot(vfit)


##extract and plot residuals:
epshat <- residuals(meanmod)
plot(epshat)


##extract and plot standardised residuals:
zhat <- residuals(varmod)
plot(zhat)
