This function is essentially a wrapper function around the gets::isat() function from the gets package.
This function allows the running of various different indicator saturation techniques that can, for example, be used to answer reverse causal questions.
Indicator Saturation techniques fully saturate a model with indicators (for example dummy-indicators or step-indicators) and then use an automated block-search
algorithm to retain only relevant indicators that improve the model (based on a chosen information criterion).
Usage
isatpanel(
  data = NULL,
  formula = NULL,
  index = NULL,
  effect = c("twoways"),
  na.remove = TRUE,
  engine = NULL,
  user.estimator = NULL,
  cluster = "none",
  ar = 0,
  iis = FALSE,
  jiis = FALSE,
  jsis = FALSE,
  fesis = FALSE,
  tis = FALSE,
  csis = FALSE,
  cfesis = FALSE,
  fesis_id = NULL,
  fesis_time = NULL,
  tis_id = NULL,
  tis_time = NULL,
  csis_var = NULL,
  csis_time = NULL,
  cfesis_var = NULL,
  cfesis_id = NULL,
  cfesis_time = NULL,
  uis = NULL,
  t.pval = 0.001,
  plot = TRUE,
  print.searchinfo = TRUE,
  plm_model = "within",
  y = NULL,
  id = NULL,
  time = NULL,
  mxreg = NULL,
  ...
)
Arguments
- data
The input data.frame object.
- formula
Formula argument. The dependent variable will be the left-most element, separated by a ~ symbol from the remaining regressors (e.g. y ~ x + z). Note the intercept will always be removed unless the effect is "none" - this means that if any fixed effects are specified, the intercept will always be removed.
- index
Specify the name of the group and time column in the format c("id", "time").
- effect
Fixed Effect specification. Possible arguments: "twoways" (Default), "individual", "time", or "none".
- na.remove
remove NAs
- engine
Estimation function to use. Default is NULL, which uses the default estimation procedure of the gets package. Alternatives are "fixest", "plm", or "felm".
- user.estimator
Use a user.estimator
- cluster
cluster Standard Errors at this level. Default is "none". Possible values are: "individual", "time", or "twoways".
- ar
Autoregressive Term to be included. default is 0.
- iis
Logical. Use Impulse Indicator Saturation.
- jiis
Logical. Use Joint Impulse Indicator Saturation (Outliers are common across all units). This is essentially just a time fixed effect, but this allows selection of FE.
- jsis
Logical. Use Join Step Indicator Saturation (steps are common across all units). Will only be retained if time fixed effects are not included (i.e. effect = 'none' or 'individual'), as they are collinear otherwise.
- fesis
Logical. Use Fixed Effect Step Indicator Saturation. Constructed by multiplying a constant (1) with group Fixed Effects. Default is
FALSE.- tis
Logical. Use Trend Indicator Saturation. Constructed by fitting a trend for each unit from every observation. Default is
FALSE.- csis
Logical. Use Coefficient Step Indicator Saturation. Constructed by Default is FALSE.
- cfesis
Logical. Use Coefficient-Fixed Effect Indicator Saturation. Default is FALSE.
- fesis_id
The FESIS method can be conducted for all (default) individuals/units (i.e. looking for breaks in individual countries) or just a subset of them. If you want to use a subset, specify the individuals/units for which you want to test the stability of the fixed effect in a character vector.
- fesis_time
The FESIS method can be conducted for all (default) time periods (i.e. looking for Fixed Effect Step-shifts at every time period) or just a subset of them. If you want to use a subset, specify the time periods as a numeric vector (for all id's the same like
1:10) or as a list with an equal number of elements as there are id's e.g.list(A = 1:10, B = NULL, C = 5:10).- tis_id
The TIS method can be conducted for all (default) individuals/units (i.e. looking for trends in individual countries) or just a subset of them. If you want to use a subset, specify the individuals/units for which you want to test the trend in a character vector.
- tis_time
The TIS method can be conducted for all (default) time periods (i.e. looking for trends at every time period) or just a subset of them. If you want to use a subset, specify the time periods as a numeric vector (for all id's the same like
1:10) or as a list with an equal number of elements as there are id's e.g.list(A = 1:10, B = NULL, C = 5:10).- csis_var
The CSIS method can be conducted for all (default) variables or just a subset of them. If you want to use a subset, please specify the column names of the variable in a character vector.
- csis_time
The CSIS method can be conducted for all (default) time periods (i.e. looking for Coefficient Step Shifts across all units at every time period) or just a subset of them. If you want to use a subset, specify the time periods as a numeric vector (e.g.
1:10).'- cfesis_var
The CFESIS method can be conducted for all variables (default) or just a subset of them. If you want to use a subset, please specify the column names of the variable in a character vector.
- cfesis_id
The CFESIS method can be conducted for all individuals/units (default) or just a subset of them. If you want to use a subset, please specify the individuals/units to be tested in a character vector.
- cfesis_time
The CFESIS method can be conducted for all (default) time periods (i.e. looking for Coefficient Step Shifts per unit at every time period) or just a subset of them. If you want to use a subset, specify the time periods as a numeric vector (for all id's the same like
1:10) or as a list with an equal number of elements as there are id's e.g.list(A = 1:10, B = NULL, C = 5:10).- uis
Matrix or List. This can be used to include a set of UIS (User Specified Indicators). Must be equal to the sample size (so it is recommended to use this only with datasets without
NAvalues. Default isNULL. See the reference by Genaro Sucarrat (2020) below for an explanation of the UIS system.- t.pval
numeric value between 0 and 1. The significance level used for the two-sided regressor significance t-tests
- plot
Logical. Should the final object be plotted? Default is TRUE. The output is a combination of
plot()andplot_grid()using thecowplotpackage.- print.searchinfo
logical. If
TRUE(default), then detailed information is printed.- plm_model
Type of PLM model (only if engine = "PLM")
- y
Deprecated. The dependent variable. Can be used when data, index, and formula are not specified.
- id
Deprecated. Can be used when data, index, and formula are not specified. Must be a vector of the grouping variable as a character or factor
- time
Deprecated. Can be used when data, index, and formula are not specified. Must be a vector of the time variable as an integer or numeric.
- mxreg
Deprecated.The co-variates matrix. Superseded by the formula argument.
- ...
Further arguments to
gets::isat()
References
Felix Pretis and Moritz Schwarz (2022). Discovering What Mattered: Answering Reverse Causal Questions by Detecting Unknown Treatment Assignment and Timing as Breaks in Panel Models. January 31, 2022. Available at SSRN: https://ssrn.com/abstract=4022745 or http://dx.doi.org/10.2139/ssrn.4022745
Genaro Sucarrat. User-Specified General-to-Specific and Indicator Saturation Methods, The R Journal (2020) 12:2, pages 388-401. Available at: https://journal.r-project.org/archive/2021/RJ-2021-024/index.html
Examples
# \donttest{
data(EU_emissions_road)
# Group specification
EU15 <- c("Austria", "Germany", "Denmark", "Spain", "Finland", "Belgium",
"France", "United Kingdom", "Ireland", "Italy", "Luxembourg",
"Netherlands", "Greece", "Portugal", "Sweden")
# Prepare sample and data
EU_emissions_road_short <- EU_emissions_road[
EU_emissions_road$country %in% EU15 &
EU_emissions_road$year >= 2000,
]
# Run
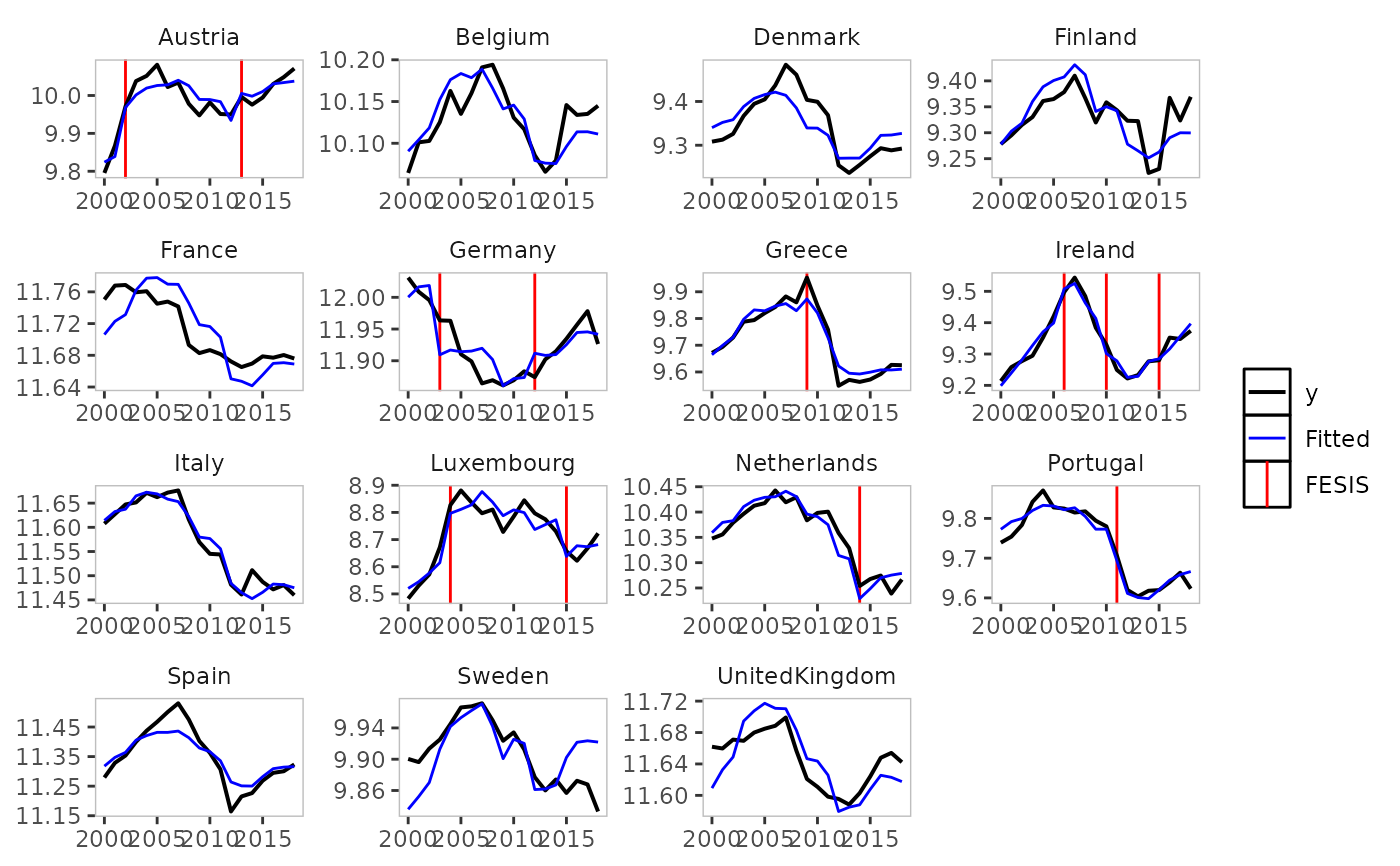
result <- isatpanel(
data = EU_emissions_road_short,
formula = ltransport.emissions ~ lgdp + I(lgdp^2) + lpop,
index = c("country", "year"),
effect = "twoways",
fesis = TRUE,
plot = FALSE,
t.pval = 0.01
)
#>
#> UIS1.fesis block 1 of 9:
#> 30 path(s) to search
#> Searching:
#> 1
#> 2
#> 3
#> 4
#> 5
#> 6
#> 7
#> 8
#> 9
#> 10
#> 11
#> 12
#> 13
#> 14
#> 15
#> 16
#> 17
#> 18
#> 19
#> 20
#> 21
#> 22
#> 23
#> 24
#> 25
#> 26
#> 27
#> 28
#> 29
#> 30
#>
#> UIS1.fesis block 2 of 9:
#> 30 path(s) to search
#> Searching:
#> 1
#> 2
#> 3
#> 4
#> 5
#> 6
#> 7
#> 8
#> 9
#> 10
#> 11
#> 12
#> 13
#> 14
#> 15
#> 16
#> 17
#> 18
#> 19
#> 20
#> 21
#> 22
#> 23
#> 24
#> 25
#> 26
#> 27
#> 28
#> 29
#> 30
#>
#> UIS1.fesis block 3 of 9:
#> 30 path(s) to search
#> Searching:
#> 1
#> 2
#> 3
#> 4
#> 5
#> 6
#> 7
#> 8
#> 9
#> 10
#> 11
#> 12
#> 13
#> 14
#> 15
#> 16
#> 17
#> 18
#> 19
#> 20
#> 21
#> 22
#> 23
#> 24
#> 25
#> 26
#> 27
#> 28
#> 29
#> 30
#>
#> UIS1.fesis block 4 of 9:
#> 30 path(s) to search
#> Searching:
#> 1
#> 2
#> 3
#> 4
#> 5
#> 6
#> 7
#> 8
#> 9
#> 10
#> 11
#> 12
#> 13
#> 14
#> 15
#> 16
#> 17
#> 18
#> 19
#> 20
#> 21
#> 22
#> 23
#> 24
#> 25
#> 26
#> 27
#> 28
#> 29
#> 30
#>
#> UIS1.fesis block 5 of 9:
#> 30 path(s) to search
#> Searching:
#> 1
#> 2
#> 3
#> 4
#> 5
#> 6
#> 7
#> 8
#> 9
#> 10
#> 11
#> 12
#> 13
#> 14
#> 15
#> 16
#> 17
#> 18
#> 19
#> 20
#> 21
#> 22
#> 23
#> 24
#> 25
#> 26
#> 27
#> 28
#> 29
#> 30
#>
#> UIS1.fesis block 6 of 9:
#> 30 path(s) to search
#> Searching:
#> 1
#> 2
#> 3
#> 4
#> 5
#> 6
#> 7
#> 8
#> 9
#> 10
#> 11
#> 12
#> 13
#> 14
#> 15
#> 16
#> 17
#> 18
#> 19
#> 20
#> 21
#> 22
#> 23
#> 24
#> 25
#> 26
#> 27
#> 28
#> 29
#> 30
#>
#> UIS1.fesis block 7 of 9:
#> 30 path(s) to search
#> Searching:
#> 1
#> 2
#> 3
#> 4
#> 5
#> 6
#> 7
#> 8
#> 9
#> 10
#> 11
#> 12
#> 13
#> 14
#> 15
#> 16
#> 17
#> 18
#> 19
#> 20
#> 21
#> 22
#> 23
#> 24
#> 25
#> 26
#> 27
#> 28
#> 29
#> 30
#>
#> UIS1.fesis block 8 of 9:
#> 30 path(s) to search
#> Searching:
#> 1
#> 2
#> 3
#> 4
#> 5
#> 6
#> 7
#> 8
#> 9
#> 10
#> 11
#> 12
#> 13
#> 14
#> 15
#> 16
#> 17
#> 18
#> 19
#> 20
#> 21
#> 22
#> 23
#> 24
#> 25
#> 26
#> 27
#> 28
#> 29
#> 30
#>
#> UIS1.fesis block 9 of 9:
#> 30 path(s) to search
#> Searching:
#> 1
#> 2
#> 3
#> 4
#> 5
#> 6
#> 7
#> 8
#> 9
#> 10
#> 11
#> 12
#> 13
#> 14
#> 15
#> 16
#> 17
#> 18
#> 19
#> 20
#> 21
#> 22
#> 23
#> 24
#> 25
#> 26
#> 27
#> 28
#> 29
#> 30
#>
#> GETS of union of retained UIS1.fesis variables...
#> 1 path(s) to search
#> Searching:
#> 1
#>
#> GETS of union of ALL retained variables...
#> 1 path(s) to search
#> Searching:
#> 1
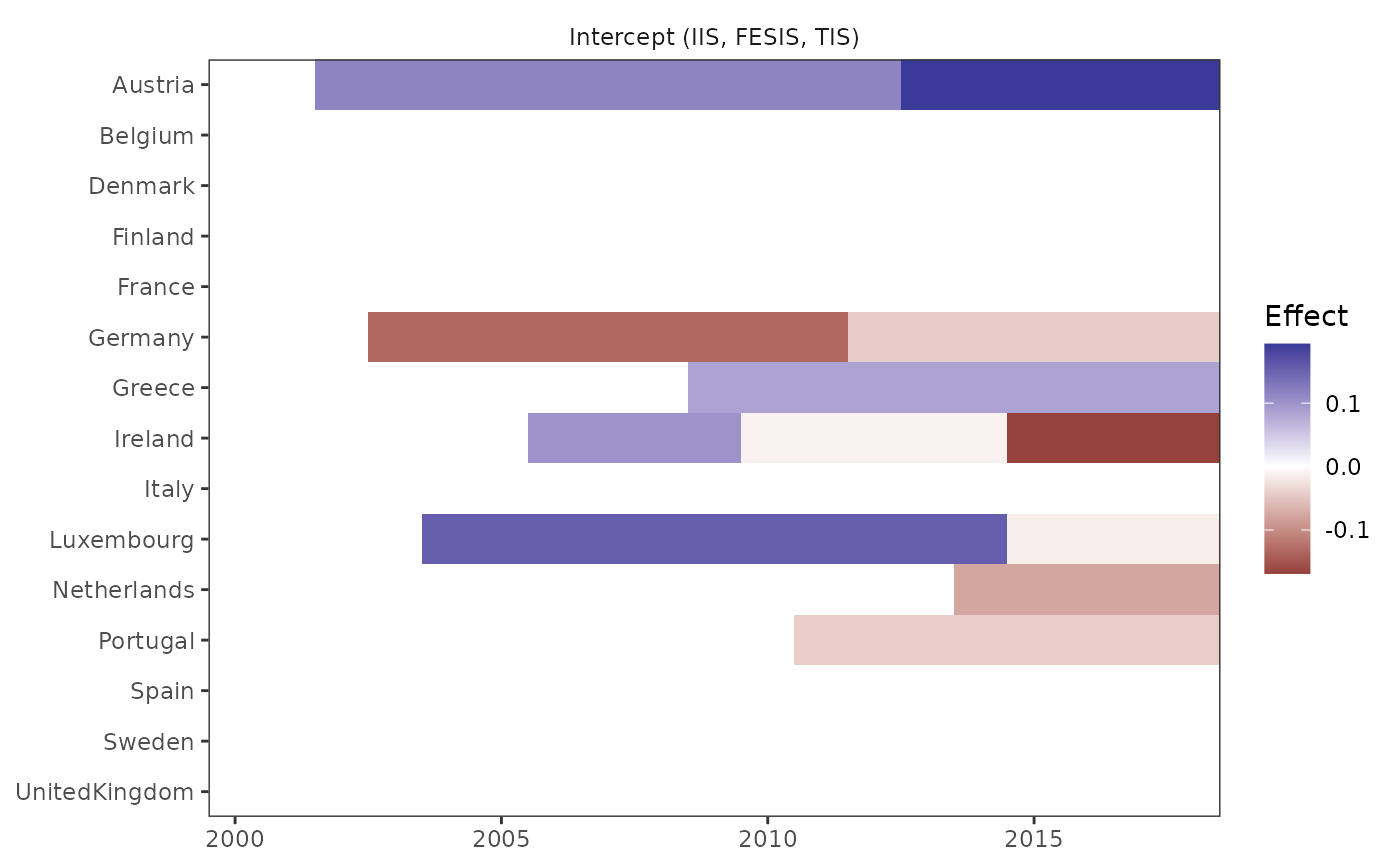
plot(result)
 plot_grid(result)
 # print the retained indicators
get_indicators(result)
#> $fesis
#> id time name
#> 1.fesisAustria.2002 Austria 2002 fesisAustria.2002
#> 1.fesisAustria.2013 Austria 2013 fesisAustria.2013
#> 1.fesisGermany.2003 Germany 2003 fesisGermany.2003
#> 1.fesisGermany.2012 Germany 2012 fesisGermany.2012
#> 1.fesisGreece.2009 Greece 2009 fesisGreece.2009
#> 1.fesisIreland.2006 Ireland 2006 fesisIreland.2006
#> 1.fesisIreland.2010 Ireland 2010 fesisIreland.2010
#> 1.fesisIreland.2015 Ireland 2015 fesisIreland.2015
#> 1.fesisLuxembourg.2004 Luxembourg 2004 fesisLuxembourg.2004
#> 1.fesisLuxembourg.2015 Luxembourg 2015 fesisLuxembourg.2015
#> 1.fesisNetherlands.2014 Netherlands 2014 fesisNetherlands.2014
#> 1.fesisPortugal.2011 Portugal 2011 fesisPortugal.2011
#>
# }
# print the retained indicators
get_indicators(result)
#> $fesis
#> id time name
#> 1.fesisAustria.2002 Austria 2002 fesisAustria.2002
#> 1.fesisAustria.2013 Austria 2013 fesisAustria.2013
#> 1.fesisGermany.2003 Germany 2003 fesisGermany.2003
#> 1.fesisGermany.2012 Germany 2012 fesisGermany.2012
#> 1.fesisGreece.2009 Greece 2009 fesisGreece.2009
#> 1.fesisIreland.2006 Ireland 2006 fesisIreland.2006
#> 1.fesisIreland.2010 Ireland 2010 fesisIreland.2010
#> 1.fesisIreland.2015 Ireland 2015 fesisIreland.2015
#> 1.fesisLuxembourg.2004 Luxembourg 2004 fesisLuxembourg.2004
#> 1.fesisLuxembourg.2015 Luxembourg 2015 fesisLuxembourg.2015
#> 1.fesisNetherlands.2014 Netherlands 2014 fesisNetherlands.2014
#> 1.fesisPortugal.2011 Portugal 2011 fesisPortugal.2011
#>
# }