Plot the estimated OSEM Model
plot.osem.RdPlot the estimated OSEM Model
Usage
# S3 method for class 'osem'
plot(
  x,
  title = "OSEM Model Output",
  exclude.exogenous = TRUE,
  order.as.run = FALSE,
  interactive = FALSE,
  first_date = NULL,
  grepl_variables = NULL,
  return.data = FALSE,
  ...
)
Arguments
- x
An object of class osem, which is the output from the run_model function.
- title
Character. Title of the plot. Default is "OSEM Model Output".
- exclude.exogenous
Logical. Should exogenous values be plotted? Default is FALSE.
- order.as.run
Logical. Should the plots be arranged in the way that the model was run? Default FALSE.
- interactive
Logical. Should the resulting plot be launched in an interactive way (the plotly package is required for this).
- first_date
Character. First date value to be shown. Must be a character value that can be turned into a date using as.Date() or NULL.
- grepl_variables
Regular Expression Character. Can be used to select variables to be plotted. Experimental feature so use with care.
- return.data
Logical. Do not return a plot but rather just the final dataset that has been created for the plot.
- ...
Additional arguments passed to the plotting function.
Examples
spec <- dplyr::tibble(
type = c(
"d",
"d",
"n"
),
dependent = c(
"StatDiscrep",
"TOTS",
"Import"
),
independent = c(
"TOTS - FinConsExpHH - FinConsExpGov - GCapitalForm - Export",
"GValueAdd + Import",
"FinConsExpHH + GCapitalForm"
)
)
# \donttest{
a <- run_model(specification = spec, dictionary = NULL,
inputdata_directory = NULL, primary_source = "download",
save_to_disk = NULL, present = FALSE)
#> Table namq_10_a10 cached at /tmp/RtmpepJCbG/eurostat/ec5b6dd50558d283aef43fac7d6aa37d.rds
#> Table namq_10_gdp cached at /tmp/RtmpepJCbG/eurostat/76dc8973b5b70862c723fa812bda8980.rds
#>
#> --- Estimation begins ---
#> Estimating Import = FinConsExpHH + GCapitalForm
#> Constructing TOTS = GValueAdd + Import
#> Constructing StatDiscrep = TOTS - FinConsExpHH - FinConsExpGov - GCapitalForm - Export
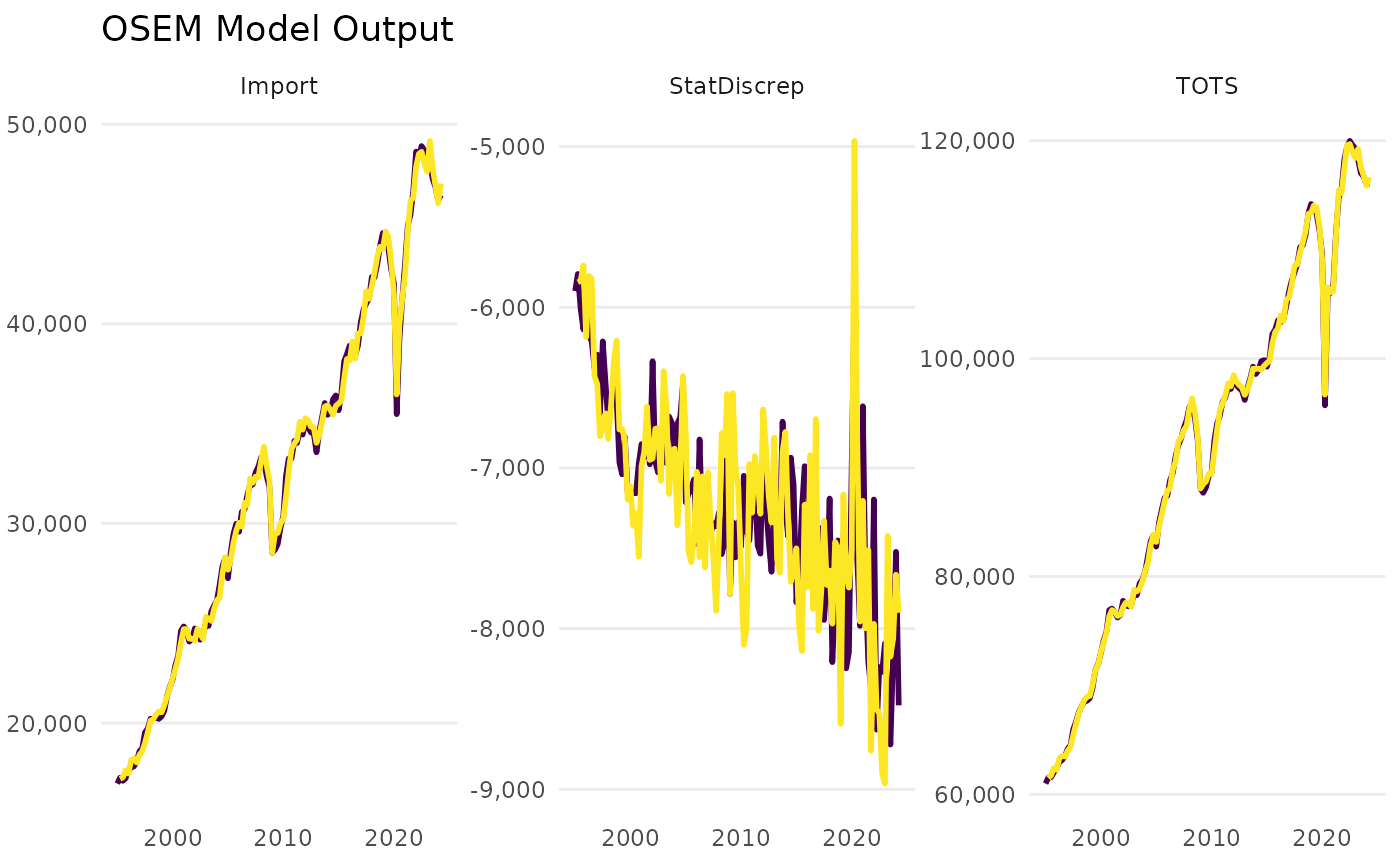
 plot(a)
 # }
# }