Plot the Counterfactual Path
Arguments
- x
An object produced by the isatpanel function
- plus_t
Number of time periods for the counterfactual to be displayed (default = 5).
- facet.scales
To be passed to ggplot2::facet_wrap. Default is "free" (i.e. a separate y axis for each panel group/id). Alternatives are: "fixed", "fixed_y", and "fixed_x".
- title
Plot title. Must be a character vector.
- zero_line
Plot a horizontal line at y = 0. Default is FALSE.
Examples
# \donttest{
data(EU_emissions_road)
# Group specification
EU15 <- c("Austria", "Germany", "Denmark", "Spain", "Finland", "Belgium",
"France", "United Kingdom", "Ireland", "Italy", "Luxembourg",
"Netherlands", "Greece", "Portugal", "Sweden")
# Prepare sample and data
EU_emissions_road_short <- EU_emissions_road[
EU_emissions_road$country %in% EU15 &
EU_emissions_road$year >= 2000,
]
# Run
result <- isatpanel(
data = EU_emissions_road_short,
formula = ltransport.emissions ~ lgdp + I(lgdp^2) + lpop,
index = c("country", "year"),
effect = "twoways",
fesis = TRUE,
plot = FALSE,
t.pval = 0.01
)
#>
#> UIS1.fesis block 1 of 9:
#> 30 path(s) to search
#> Searching:
#> 1
#> 2
#> 3
#> 4
#> 5
#> 6
#> 7
#> 8
#> 9
#> 10
#> 11
#> 12
#> 13
#> 14
#> 15
#> 16
#> 17
#> 18
#> 19
#> 20
#> 21
#> 22
#> 23
#> 24
#> 25
#> 26
#> 27
#> 28
#> 29
#> 30
#>
#> UIS1.fesis block 2 of 9:
#> 30 path(s) to search
#> Searching:
#> 1
#> 2
#> 3
#> 4
#> 5
#> 6
#> 7
#> 8
#> 9
#> 10
#> 11
#> 12
#> 13
#> 14
#> 15
#> 16
#> 17
#> 18
#> 19
#> 20
#> 21
#> 22
#> 23
#> 24
#> 25
#> 26
#> 27
#> 28
#> 29
#> 30
#>
#> UIS1.fesis block 3 of 9:
#> 30 path(s) to search
#> Searching:
#> 1
#> 2
#> 3
#> 4
#> 5
#> 6
#> 7
#> 8
#> 9
#> 10
#> 11
#> 12
#> 13
#> 14
#> 15
#> 16
#> 17
#> 18
#> 19
#> 20
#> 21
#> 22
#> 23
#> 24
#> 25
#> 26
#> 27
#> 28
#> 29
#> 30
#>
#> UIS1.fesis block 4 of 9:
#> 30 path(s) to search
#> Searching:
#> 1
#> 2
#> 3
#> 4
#> 5
#> 6
#> 7
#> 8
#> 9
#> 10
#> 11
#> 12
#> 13
#> 14
#> 15
#> 16
#> 17
#> 18
#> 19
#> 20
#> 21
#> 22
#> 23
#> 24
#> 25
#> 26
#> 27
#> 28
#> 29
#> 30
#>
#> UIS1.fesis block 5 of 9:
#> 30 path(s) to search
#> Searching:
#> 1
#> 2
#> 3
#> 4
#> 5
#> 6
#> 7
#> 8
#> 9
#> 10
#> 11
#> 12
#> 13
#> 14
#> 15
#> 16
#> 17
#> 18
#> 19
#> 20
#> 21
#> 22
#> 23
#> 24
#> 25
#> 26
#> 27
#> 28
#> 29
#> 30
#>
#> UIS1.fesis block 6 of 9:
#> 30 path(s) to search
#> Searching:
#> 1
#> 2
#> 3
#> 4
#> 5
#> 6
#> 7
#> 8
#> 9
#> 10
#> 11
#> 12
#> 13
#> 14
#> 15
#> 16
#> 17
#> 18
#> 19
#> 20
#> 21
#> 22
#> 23
#> 24
#> 25
#> 26
#> 27
#> 28
#> 29
#> 30
#>
#> UIS1.fesis block 7 of 9:
#> 30 path(s) to search
#> Searching:
#> 1
#> 2
#> 3
#> 4
#> 5
#> 6
#> 7
#> 8
#> 9
#> 10
#> 11
#> 12
#> 13
#> 14
#> 15
#> 16
#> 17
#> 18
#> 19
#> 20
#> 21
#> 22
#> 23
#> 24
#> 25
#> 26
#> 27
#> 28
#> 29
#> 30
#>
#> UIS1.fesis block 8 of 9:
#> 30 path(s) to search
#> Searching:
#> 1
#> 2
#> 3
#> 4
#> 5
#> 6
#> 7
#> 8
#> 9
#> 10
#> 11
#> 12
#> 13
#> 14
#> 15
#> 16
#> 17
#> 18
#> 19
#> 20
#> 21
#> 22
#> 23
#> 24
#> 25
#> 26
#> 27
#> 28
#> 29
#> 30
#>
#> UIS1.fesis block 9 of 9:
#> 30 path(s) to search
#> Searching:
#> 1
#> 2
#> 3
#> 4
#> 5
#> 6
#> 7
#> 8
#> 9
#> 10
#> 11
#> 12
#> 13
#> 14
#> 15
#> 16
#> 17
#> 18
#> 19
#> 20
#> 21
#> 22
#> 23
#> 24
#> 25
#> 26
#> 27
#> 28
#> 29
#> 30
#>
#> GETS of union of retained UIS1.fesis variables...
#> 1 path(s) to search
#> Searching:
#> 1
#>
#> GETS of union of ALL retained variables...
#> 1 path(s) to search
#> Searching:
#> 1
plot(result)
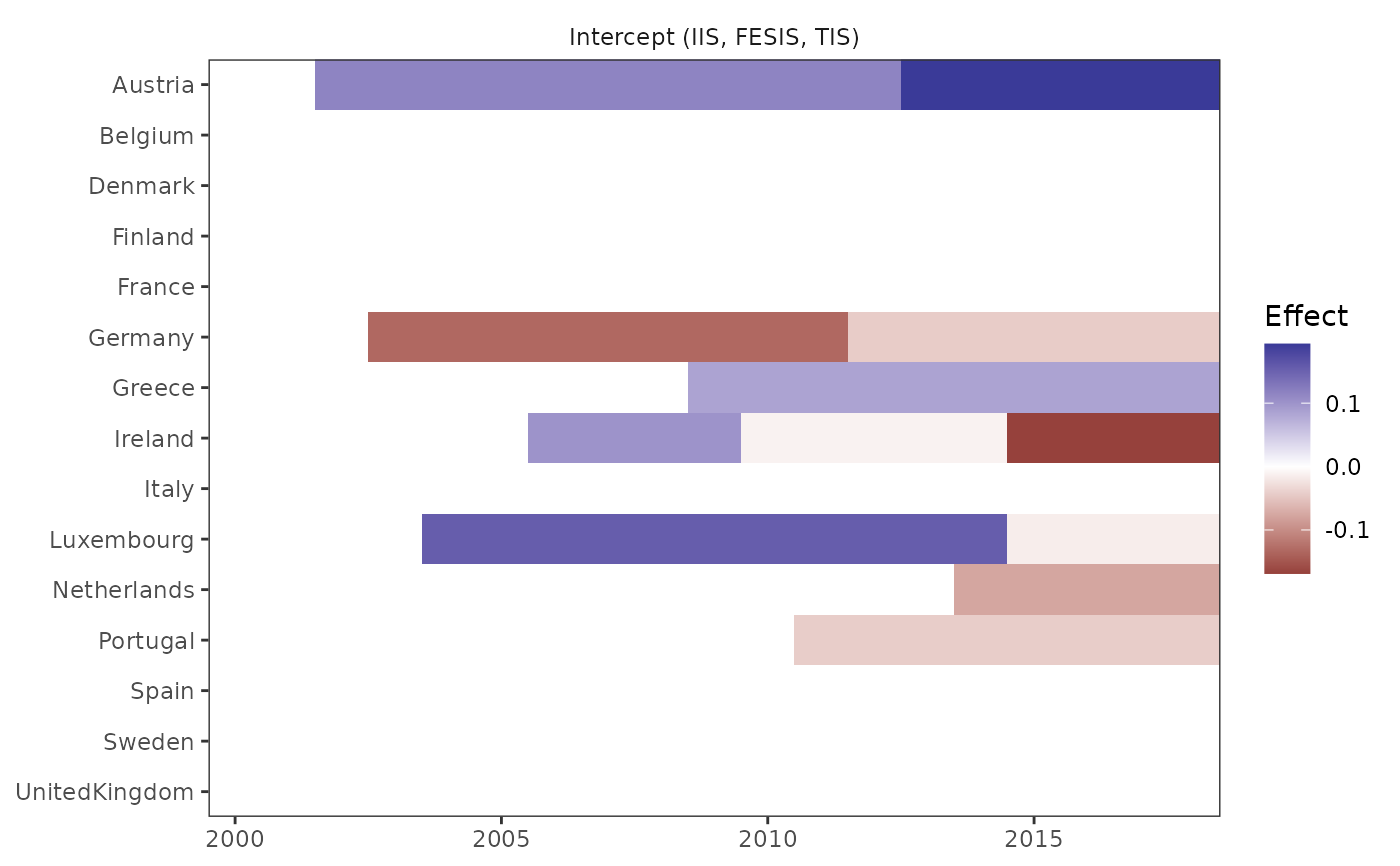
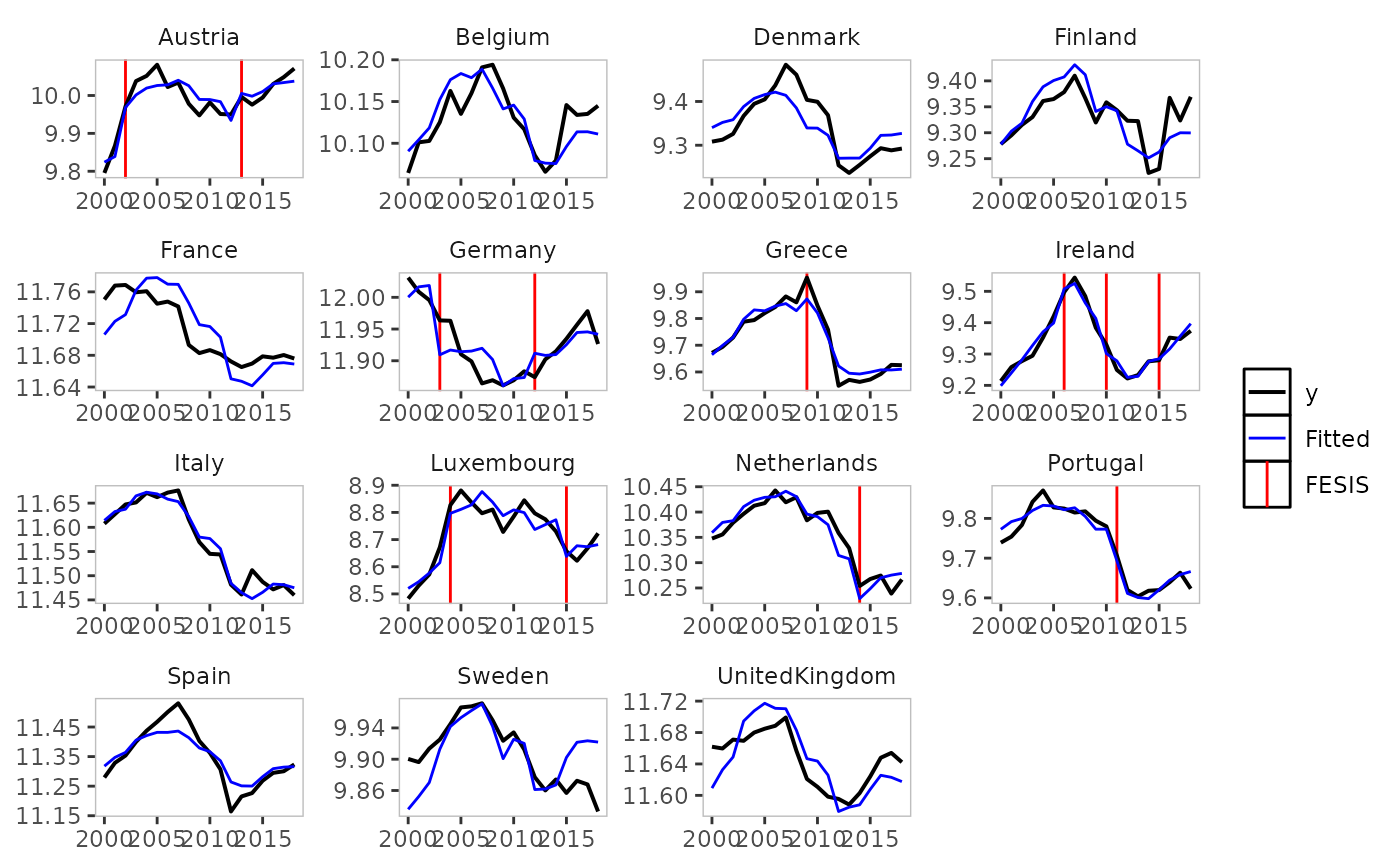 plot_grid(result)
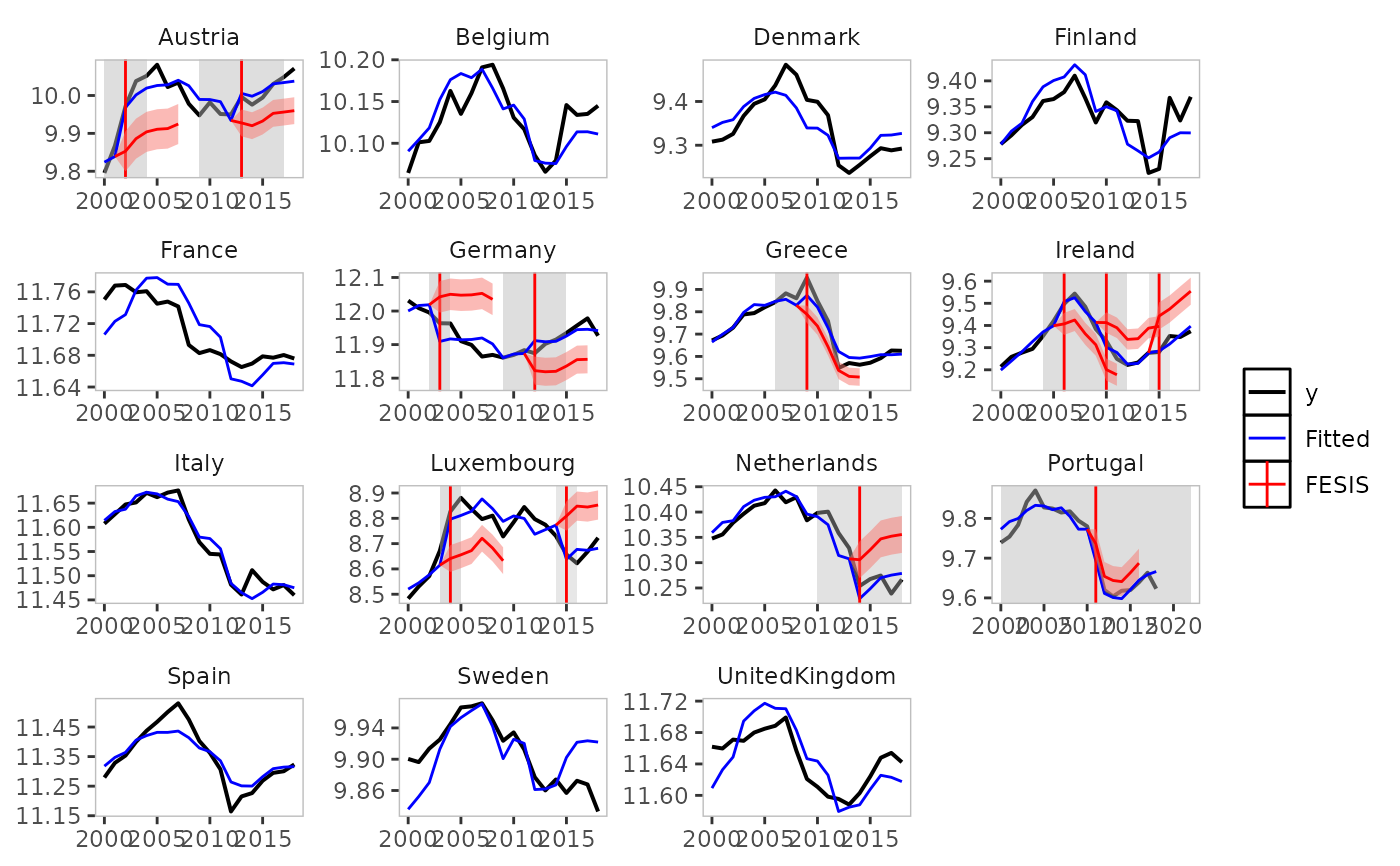
 plot_counterfactual(result)
 # }
# }