Extraction functions for 'isat' objects
coef.isat.RdExtraction functions for objects of class 'isat'
Usage
# S3 method for class 'isat'
coef(object, ...)
  # S3 method for class 'isat'
fitted(object, ...)
  # S3 method for class 'isat'
logLik(object, ...)
  # S3 method for class 'isat'
plot(x, col=c("red","blue"), lty=c("solid","solid"),
    lwd=c(1,1), coef.path=TRUE, ...)
  # S3 method for class 'isat'
predict(object, n.ahead=12, newmxreg=NULL, newindex=NULL,
    n.sim=2000, probs=NULL, ci.levels=NULL, quantile.type=7,
    return=TRUE, verbose=FALSE, plot=NULL, plot.options=list(), ...)
  # S3 method for class 'isat'
print(x, signif.stars=TRUE, ...)
  # S3 method for class 'isat'
residuals(object, std=FALSE, ...)
  # S3 method for class 'isat'
sigma(object, ...)
  # S3 method for class 'isat'
summary(object, ...)
  # S3 method for class 'isat'
vcov(object, ...)
Arguments
- object
an object of class 'isat'
- x
an object of class 'isat'
- std
logical. If
FALSE(default), then the mean residuals are returned. If TRUE, then the standardised residuals are returned- n.ahead
integerthat determines how many steps ahead predictions should be generated (the default is 12)- newmxreg
a
matrixofn.aheadrows andNCOL(mxreg)columns with the out-of-sample values of themxregregressors- newindex
NULL(default) or the date-index for thezooobject returned bypredict.arx. IfNULL, then the function uses the in-sampleindexto generate the out-of-sample index- n.sim
integer, the number of replications used for the generation of the forecasts- probs
NULL(default) or avectorwith the quantile-levels (values strictly between 0 and 1) of the forecast distribution. IfNULL, then no quantiles are returned unlessci.levelsis non-NULL- ci.levels
NULL(default) or avectorwith the confidence levels (expressed as values strictly between 0 and 1) of the forecast distribution. The upper and lower values of the confidence interval(s) are returned as quantiles- quantile.type
an integer between 1 and 9 that selects which algorithm to be used in computing the quantiles, see the argument
typeinquantile- return
logical. If
TRUE(default), then the out-of-sample predictions are returned. The valueFALSE, which does not return the predictions, may be of interest if only a prediction plot is of interest- verbose
logical with default
FALSE. IfTRUE, then additional information (typically the quantiles and/or the simulated series) used in the generation of forecasts is returned. IfFALSE, then only the forecasts are returned- plot
NULL(default) or logical. IfNULL, then the value set byoptions$plot(seeoptions) determines whether a plot is produced or not. IfTRUE, then the out-of-sample forecasts are plotted.- plot.options
a
listof options related to the plotting of forecasts, see 'Details'- col
colours of fitted (default=red) and actual (default=blue) lines
- lty
types of fitted (default=solid) and actual (default=solid) lines
- lwd
widths of fitted (default=1) and actual (default=1) lines
- coef.path
logical. Only applicable if there are retained indicators after the application of
isat- signif.stars
logical. IfTRUE, then p-values are additionally encoded visually, seeprintCoefmat- ...
additional arguments
Details
The plot.options argument is a list that controls the prediction plot, see 'Details' in predict.arx
Value
- coef:
numeric vector containing parameter estimates
- fitted:
a
zooobject with fitted values- logLik:
a numeric, the log-likelihood (normal density)
- plot:
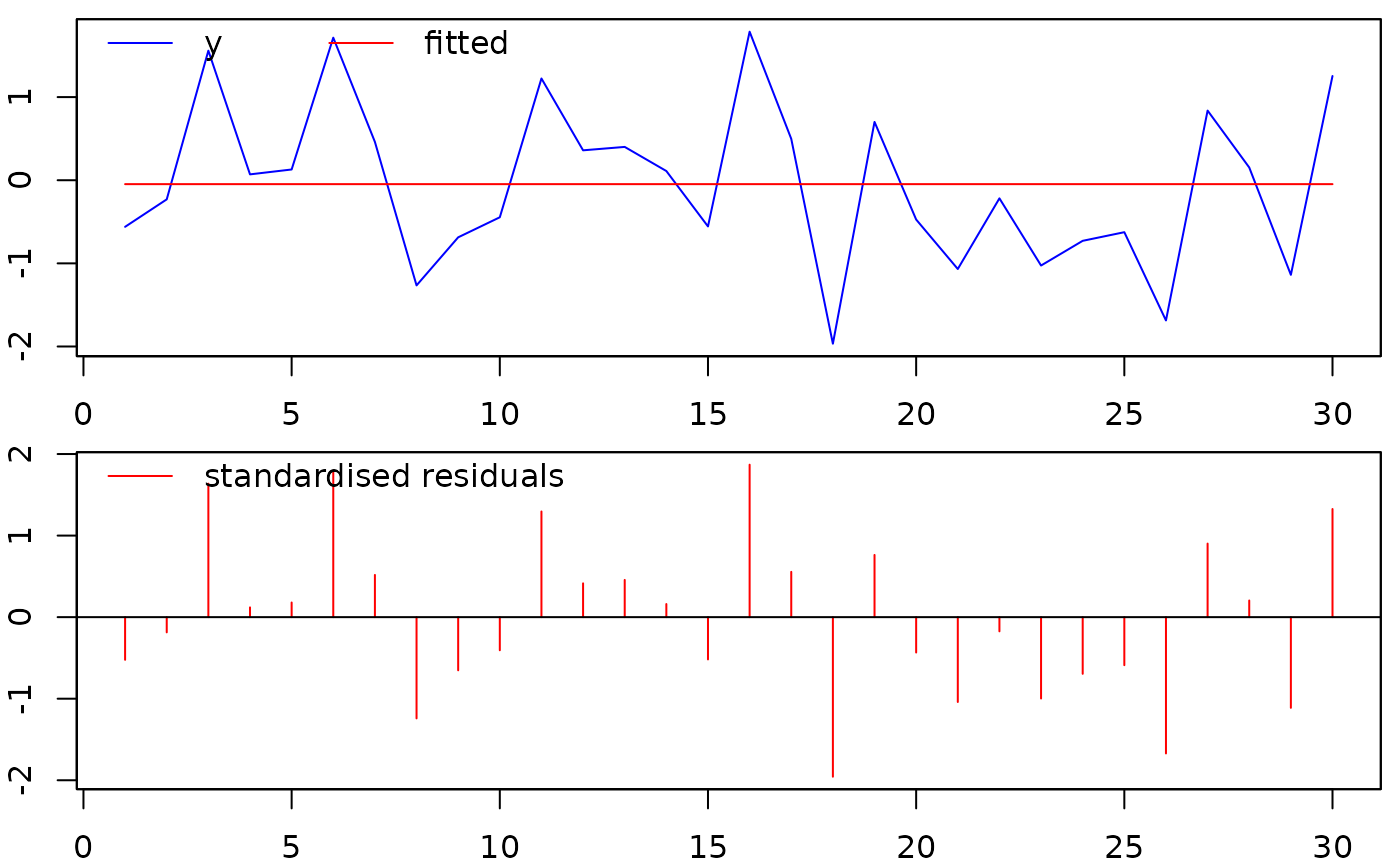
plot of the fitted values and the residuals
- predict:
a
vectorof classzoocontaining the out-of-sample forecasts, or amatrixof classzoocontaining the out-of-sample forecasts together with prediction-quantiles, or - ifreturn=FALSE-NULL- print:
a print of the estimation results
- residuals:
a
zooobject with the residuals- sigma:
the regression standard error ('SE of regression')
- summary:
a print of the items in the
isatobject- vcov:
variance-covariance matrix
Author
Felix Pretis, https://felixpretis.climateeconometrics.org/
James Reade, https://sites.google.com/site/jjamesreade/
Moritz Schwarz, https://www.inet.ox.ac.uk/people/moritz-schwarz
Genaro Sucarrat, https://www.sucarrat.net/
Examples
##step indicator saturation:
set.seed(123)
y <- rnorm(30)
isatmod <- isat(y)
#>
#> SIS block 1 of 2:
#> 15 path(s) to search
#> Searching:
#> 1
#> 2
#> 3
#> 4
#> 5
#> 6
#> 7
#> 8
#> 9
#> 10
#> 11
#> 12
#> 13
#> 14
#> 15
#>
#> SIS block 2 of 2:
#> 14 path(s) to search
#> Searching:
#> 1
#> 2
#> 3
#> 4
#> 5
#> 6
#> 7
#> 8
#> 9
#> 10
#> 11
#> 12
#> 13
#> 14
#>
#> GETS of union of retained SIS variables...
#>
#> GETS of union of ALL retained variables...

##print results:
print(isatmod)
#>
#> Date: Mon Apr  7 09:08:18 2025
#> Dependent var.: y
#> Method: Ordinary Least Squares (OLS)
#> Variance-Covariance: Ordinary
#> No. of observations (mean eq.): 30
#> Sample: 1 to 30
#>
#> SPECIFIC mean equation:
#>
#>             coef std.error t-stat p-value
#> mconst -0.047104  0.179111 -0.263  0.7944
#>
#> Diagnostics and fit:
#>
#>                     Chi-sq df p-value
#> Ljung-Box AR(1)   0.046575  1 0.82913
#> Ljung-Box ARCH(1) 3.367118  1 0.06651 .
#> ---
#> Signif. codes:  0 ‘***’ 0.001 ‘**’ 0.01 ‘*’ 0.05 ‘.’ 0.1 ‘ ’ 1
#>
#> SE of regression   0.98103
#> R-squared          0.00000
#> Log-lik.(n=30)   -41.49361

##plot the fitted vs. actual values, and the residuals:
plot(isatmod)


##print the entries of object 'isatmod':
summary(isatmod)
#>                     Length Class      Mode
#> ISfinalmodels        1     -none-     list
#> ISnames              0     -none-     NULL
#> time.started         1     -none-     character
#> time.finished        1     -none-     character
#> call                 2     -none-     call
#> no.of.estimations    1     -none-     numeric
#> terminals            1     -none-     list
#> terminals.results    4     -none-     numeric
#> best.terminal        1     -none-     numeric
#> specific.spec        1     -none-     numeric
#> no.of.getsFun.calls  1     -none-     numeric
#> gets.type            1     -none-     character
#> date                 1     -none-     character
#> version              1     -none-     character
#> aux                 15     -none-     list
#> n                    1     -none-     numeric
#> k                    1     -none-     numeric
#> df                   1     -none-     numeric
#> coefficients         1     -none-     numeric
#> mean.fit            30     zoo        numeric
#> residuals           30     zoo        numeric
#> rss                  1     -none-     numeric
#> sigma2               1     -none-     numeric
#> vcov.mean            1     -none-     numeric
#> logl                 1     -none-     numeric
#> var.fit             30     zoo        numeric
#> std.residuals       30     zoo        numeric
#> mean.results         4     data.frame list
#> diagnostics          6     -none-     numeric

##extract coefficients of the simplified (specific) model:
coef(isatmod)
#>      mconst
#> -0.04710376

##extract log-likelihood:
logLik(isatmod)
#> 'log Lik.' -41.49361 (df=1)

##extract the coefficient-covariance matrix of simplified
##(specific) model:
vcov(isatmod)
#>            mconst
#> mconst 0.03208071

##extract and plot the fitted values:
mfit <- fitted(isatmod)
plot(mfit)


##extract and plot (mean) residuals:
epshat <- residuals(isatmod)
plot(epshat)


##extract and plot standardised residuals:
zhat <- residuals(isatmod, std=TRUE)
plot(zhat)


##generate forecasts of the simplified (specific) model:
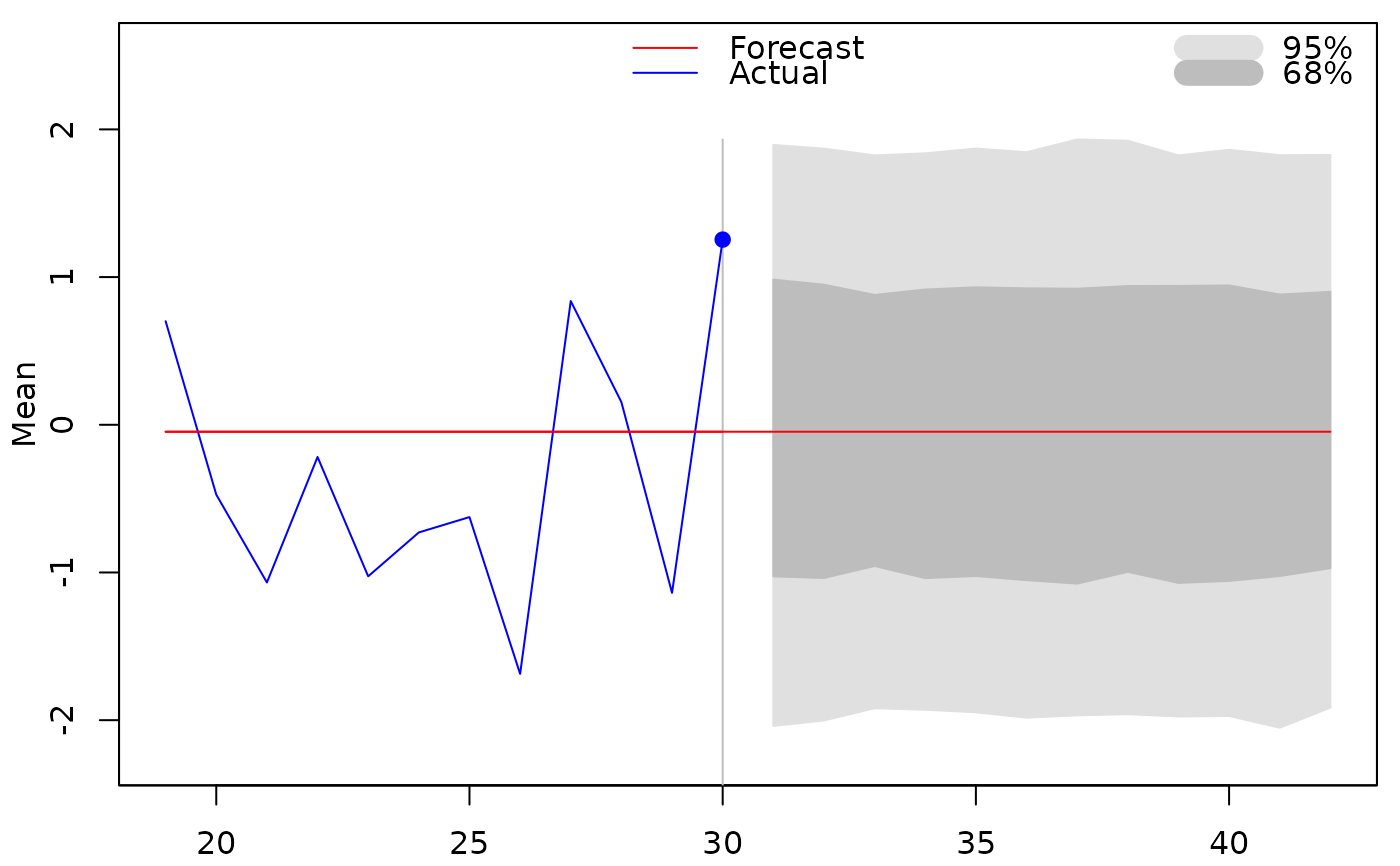
predict(isatmod, newmxreg=matrix(1,12,1), plot=TRUE)

#>          31          32          33          34          35          36
#> -0.04710376 -0.04710376 -0.04710376 -0.04710376 -0.04710376 -0.04710376
#>          37          38          39          40          41          42
#> -0.04710376 -0.04710376 -0.04710376 -0.04710376 -0.04710376 -0.04710376